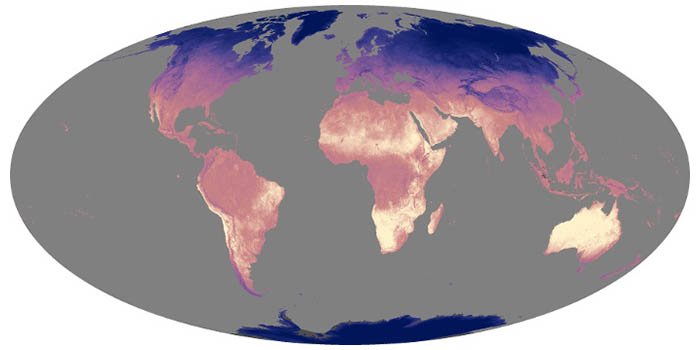
Land surface temperatures rise and fall with the heat of the Sun, and they represent how hot or cold the surface would feel to touch. These maps show daytime land temperatures as measured from space.
Feb 2000 — May 2025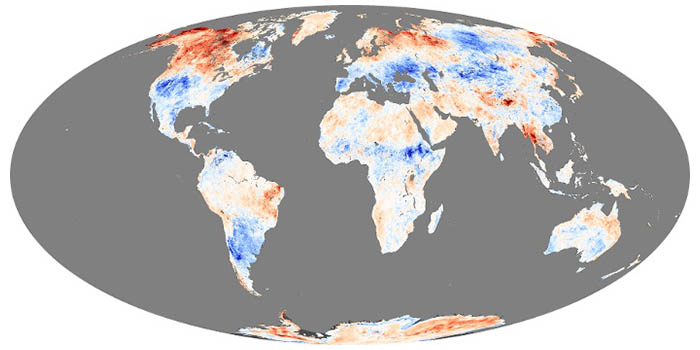
These maps depict anomalies in land surface temperatures (LSTs); that is, how much hotter or cooler a region was compared to the long-term average. LST anomalies can indicate heat waves or cold spells.
Feb 2000 — May 2025
Unusually warm sea surface temperatures lingered for months in the waters around the U.K. and Ireland in spring 2025.
Published May 30, 2025
Temperatures soared across the island during an early, widespread, and long-lasting hot spell.
Published May 29, 2025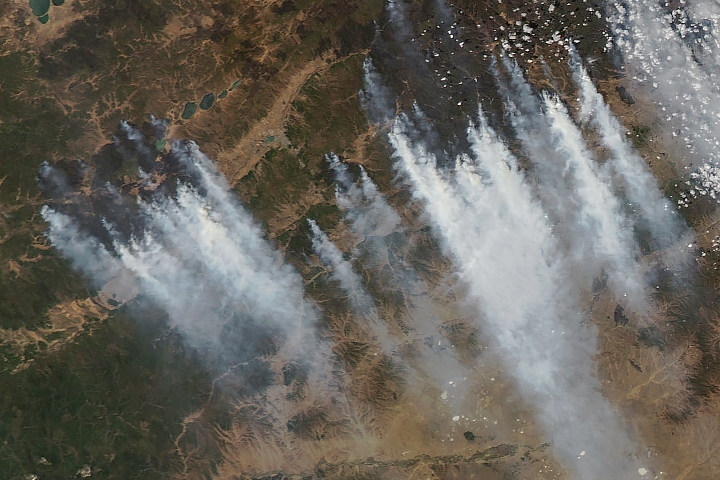
Plumes choked Siberian skies as early-season wildland fires burned near a city in eastern Russia.
Published May 21, 2025