Two rivers diverge in a tropical rainforest of South America. And that has made some scientists do a double take.

Hurricane Barbara and Tropical Storm Cosme lined up off the western coast of Mexico.
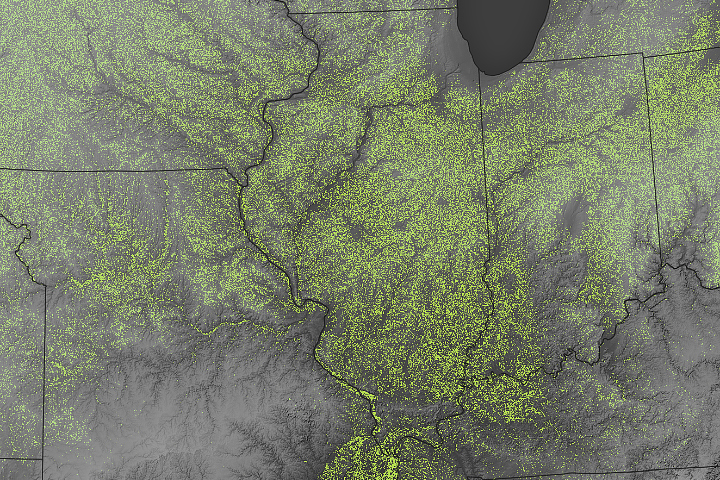
The Midwest state has flat land, fertile soils, and the nation’s largest soybean harvest.
Published Jun 12, 2025
Your challenge is to tell us the location of the satellite image and why it is interesting.
Published Jun 10, 2025

One of the strongest tornadoes to hit the area left a long scar across the landscape.
Published Jun 9, 2025
Astronauts have photographed the diminishing lake in Central Africa for decades, most recently in January 2025, as its area remained just a fraction of its past size.
Published Jun 8, 2025
Agricultural fields in north-central Montana, where wheat grows in abundance, display captivating patterns when viewed from above.
Published Jun 7, 2025
Fires in northern Alberta temporarily disrupted Canadian oil production.
Published Jun 5, 2025
Smoke from wildland fires in Canada streamed over colorful seawater east of Greenland.
Published Jun 4, 2025
The rock and ice avalanche that overtook Blatten was exceptionally large for the Alps.
Published Jun 3, 2025
What do you do when presented with a new satellite image? Here's what the Earth Observatory team does to understand the view.
Published Nov 18, 2013Have you ever wondered what it would be like to live in a different part of the world? What would the weather be like? What kinds of animals would you see? Which plants live there? By investigating these questions, you are learning about biomes.
Published Aug 28, 2020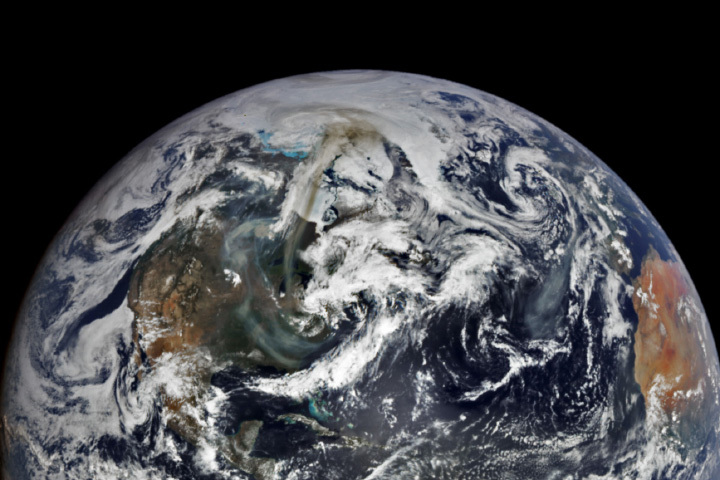
Canadian wildfires produced smoke plumes so vast they were visible from deep space and caused hazy skies as far south as Florida.
Published Jun 2, 2025
The Mississippi River has shaped the landscape in southeastern Louisiana, supporting agriculture and connecting the region with vital trade and navigation routes.
Published Jun 1, 2025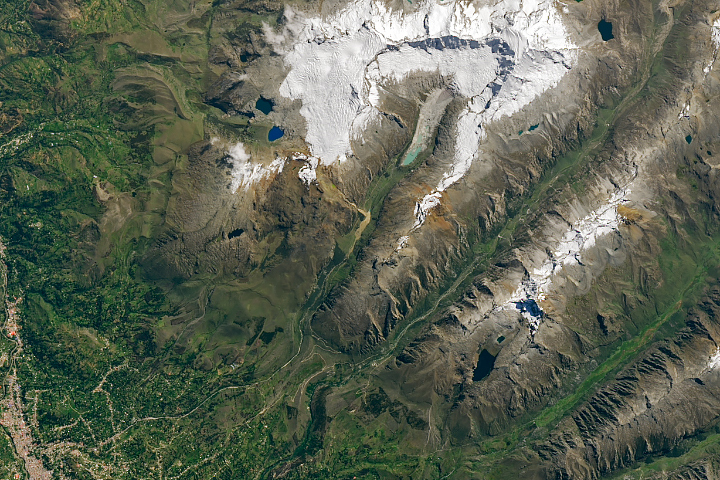
Rockfalls overwhelmed one of Vallunaraju’s glacial lakes, unleashing a destructive debris flow that struck the city of Huaraz.
Published May 30, 2025
Ocean temperatures can influence weather, such as hurricane formation, and climate patterns, such as El Niño. These maps show the temperature at the surface of the world’s seas and oceans.

Unusually warm sea surface temperatures lingered for months in the waters around the U.K. and Ireland in spring 2025.
Published May 30, 2025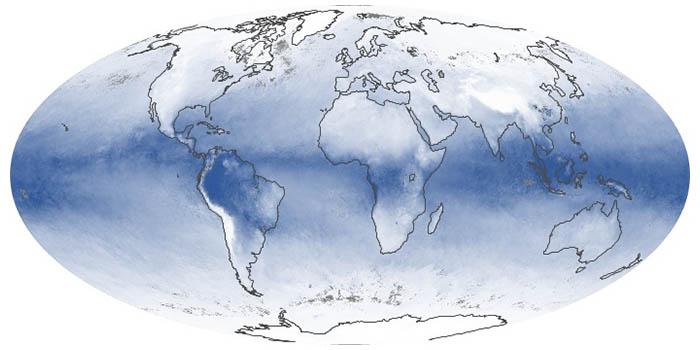
These maps show the average amount of water vapor in a column of atmosphere by month. Water vapor is the key precursor for rain and snow and one of the most important greenhouse gases in the atmosphere.

In addition to making rain and snow, clouds can have a warming or cooling influence depending on their altitude, type, and when they form. These maps show what fraction of an area was cloudy each month.

NASA satellites document how our world—forests, oceans, human landscapes, even the Sun—changes over months, seasons, and years.
Published Apr 29, 2009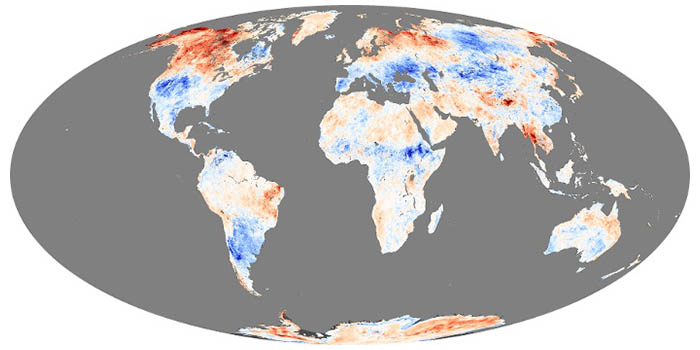
These maps depict anomalies in land surface temperatures (LSTs); that is, how much hotter or cooler a region was compared to the long-term average. LST anomalies can indicate heat waves or cold spells.

Your challenge is to tell us the location of the satellite image and why it is interesting.
Published May 19, 2025

Hurricane season in the basin runs from June 1 to November 30.
Published Jul 1, 2024
People have developed systems to harvest and store energy from sources such as wind, sunlight, and tidal action. Many of these installations are visible from orbit.
Published May 10, 2024
From ground-level ozone to particulate matter to nitrogen dioxide, an array of gasses and particles can affect the air people breathe, with implications for human health.
Published Apr 8, 2024
Warmer-than-average temperatures are showing up locally and globally, with consequences for people, landscapes, and ecosystems.
Published Mar 26, 2024
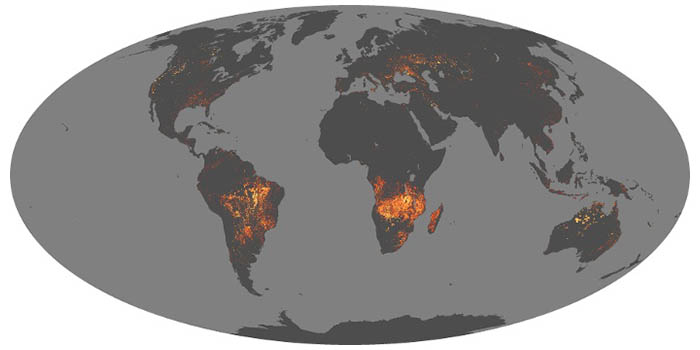
Whether sparked by lightning, intentional land-clearing, or human-caused accidents, wildland fires are burning longer and more often in some areas as the world warms.
Published Feb 27, 2024
Satellite images of Earth at night have been a curiosity for the public and a tool of fundamental research for at least 25 years. They have provided a broad, beautiful picture, showing how humans have shaped the planet and lit up the darkness.
Published Apr 12, 2017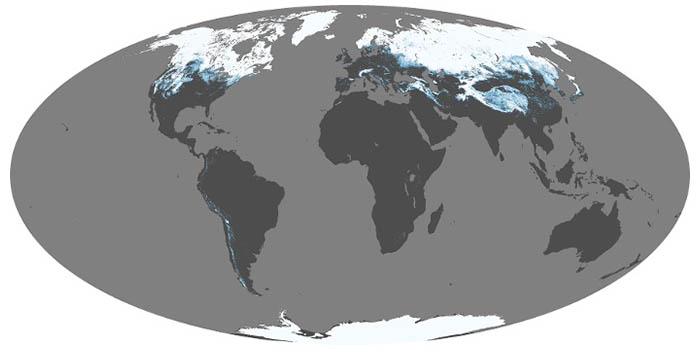
Snow and ice influence climate by reflecting sunlight back into space. When it melts, snow is a source of water for drinking and vegetation; too much snowmelt can lead to floods. These maps show average snow cover by month.

Warmer-than-average temperatures are showing up locally and globally, with consequences for people, landscapes, and ecosystems.
Published Aug 15, 2023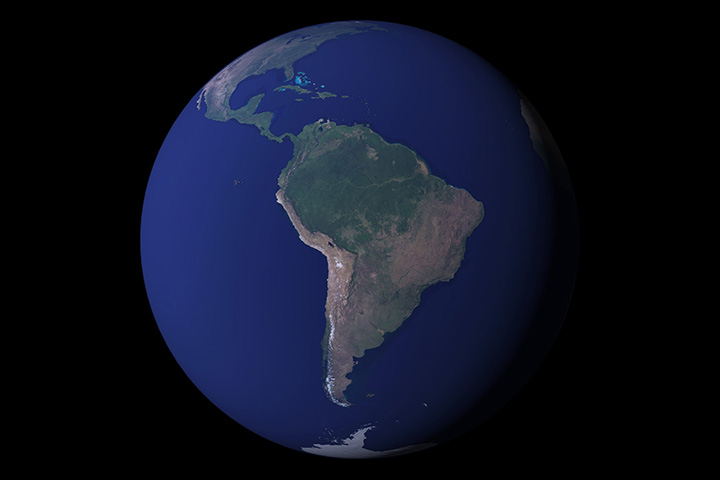
12 months of high-resolution global true color satellite imagery.
Published Oct 13, 2005